
Game Possessions
updated February 10, 2025
Football games are contested between two teams as a series of alternating possessions. The vast majority of game possessions consist of one or more offensive scrimmage plays in which the team in control of the ball attempts to advance it in order to score while its opponent attempts to deny that effort. Less frequent possession types include defensive, special teams, and overtime possessions.
From 2007 to 2024, games between FBS opponents averaged 26.1 total possessions with a median total of 26 possessions per game (13 for each team). The chart below illustrates the distribution of possession counts per game over the 18-season span (13,322 games played between FBS opponents).
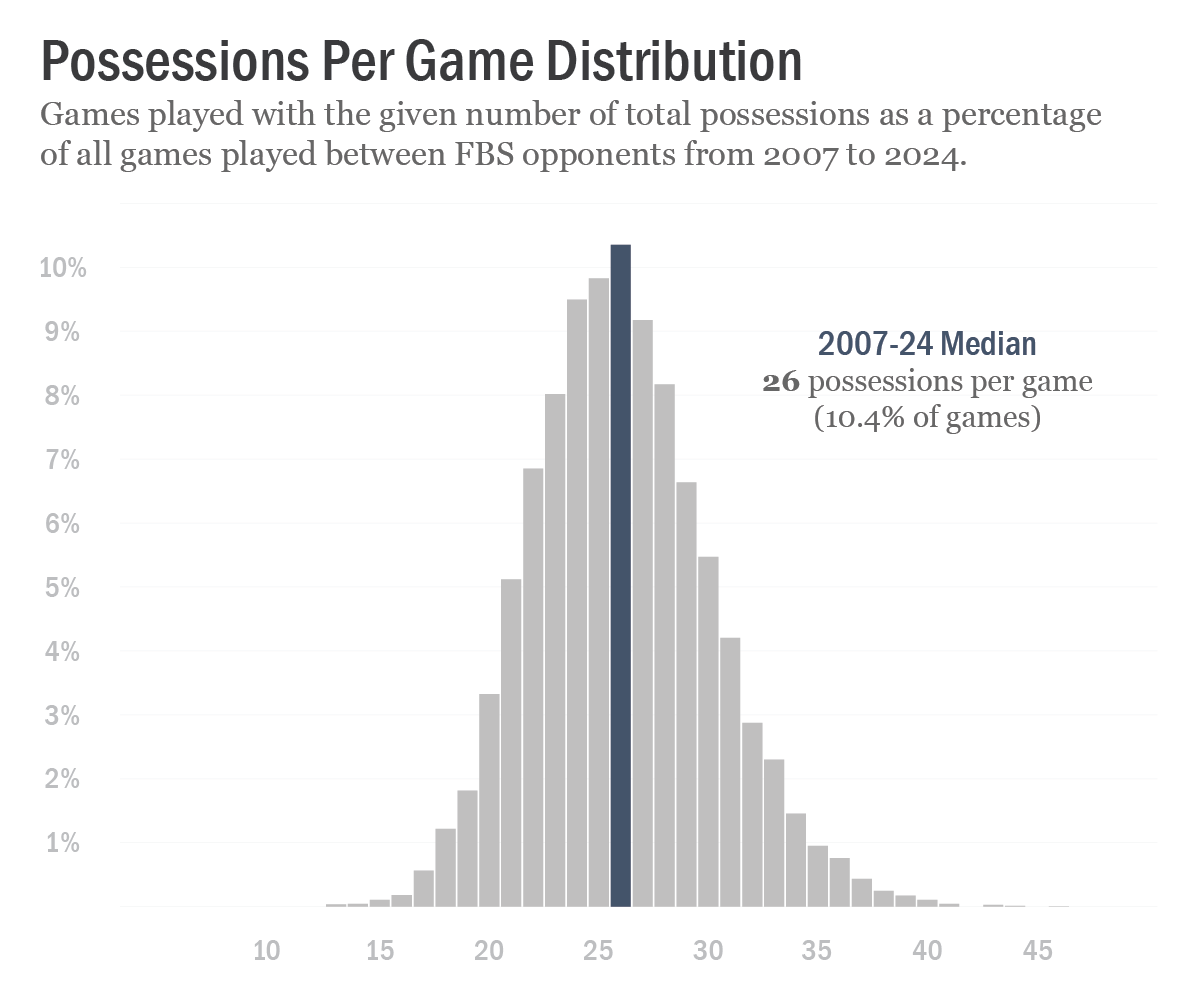
Styles of play favored by certain teams can lend themselves to outlier game possession totals, but several significant changes in game and play clock rules have impacted the sport as a whole. New rules in 2008 instituted a 40-second play clock and eliminated clock stoppages on out-of-bounds plays. In 2023, a new rule eliminated clock stoppages on first downs. Rule changes in combination with pace of play trends have impacted the average number of possessions per game over the last 18 seasons.

In 2014, 45.3% of games between FBS opponents had at least 28 total game possessions and 20.9% of games had fewer than 24 possessions. Ten years later it was effectively the opposite -- 44.7% of games in 2024 had fewer than 24 possessions and 19.8% of games had at least 28 possessions.
Games with very few possessions generally feature long drives by methodical, ball-control offenses that drain the game clock between snaps. Games with many possessions feature frequent game clock stoppages, often due to a combination of incomplete passes, three-and-outs, and quick scoring drives. Overtime games also tally up extra possessions.
Fewest Possessions in a Game Since 2007
Most Possessions in a Game Since 2007
Date
Winning Team
Losing Team
Final
Poss
Date
Winning Team
Losing Team
Final
Poss
11/25/2008
Navy
Northern Illinois
13
11/14/2015
Arkansas State
UL Monroe
46
11/5/2016
Navy
Notre Dame
13
11/3/2007
Rice
UTEP
44
11/4/2017
Army
Air Force
13
12/22/2014
Memphis
BYU
44
11/18/2017
Stanford
California
13
9/26/2015
Marshall
Kent State
43
11/9/2024
Army
North Texas
13
9/24/2016
Tulane
Louisiana
43
12/9/2017
Army
Navy
14
10/8/2016
Texas A&M
Tennessee
43
9/5/2020
Army
Middle Tennessee
14
10/22/2022
Marshall
James Madison
43
10/17/2020
Notre Dame
Louisville
14
11/28/2020
Hawaii
Nevada
14
8/24/2024
Georgia Tech
Florida State
14